
AI Real Estate Maps – Explore Smart Property Insights
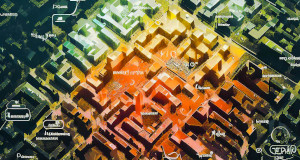
Get an insightful overview of your city's neighborhoods with our data-rich heatmaps, highlighting value growth, demand, safety and more. All below maps are self-updating and always show the latest data.

Growth Map
Learn about the GTA neighborhoods that have experienced the highest growth in the last 10 years.
Language Map
Discover linguistic diversity across neighborhoods with our color-coded map and interactive chart.

Market Demand Map
Explore neighborhood market demand with our heatmap displaying the real estate absorption rate.

Bidding Map
Navigate market competition with our heatmap illustrating bidding offsets across neighborhoods.

Gentrification Map
Explore urban dynamics with our heatmap of gentrification trends, driven by affordability indices.

Schools Map
Explore school availability and quality across neighborhoods with our insightful heatmap.

Crime Map
Analyze neighborhood safety with our heatmap providing crime rates across different jurisdictions.